Power BI Desktop 2015 SU09 introduced a really cool new feature called calculated tables. Those of you who are already familiar with calculated columns will share my excitement since we now have a flexible, intuitive, and visual way of solving common business problems which were very hard, if not impossible, to tackle previously. Today I am going to show you how to leverage calculated tables to display monthly total number of subscribers starting from a table listing each user account’s start and end dates. The sample data is taken from Kathi Kellenberger’s blog post T-SQL Window Functions Speed Phreakery. If you are a SQL junkie, you should read Kathi’s blog to learn a few clever ways of writing ever faster T-SQL queries to calculate monthly total subscriber numbers from the original data. A sample of the source data is shown in Figure 1.
| Registration_ID | FirstName | LastName | DateJoined | DateLeft |
|---|---|---|---|---|
| 15 | Norma | Lynch | 1/4/2004 | 8/20/2008 |
| 19 | Bobbie | Brennan | 1/5/2004 | 9/20/2006 |
| 22 | Terra | Cabrera | 1/5/2004 | 4/14/2007 |
| 25 | Alicia | Navarro | 1/6/2004 | 12/3/2007 |
| 55 | Lauren | Everett | 1/10/2004 | 12/5/2005 |
Figure 1.
Our goal is to find out the total number of subscribers at the end of each month taking into account the total number of subscribers joined and left from the beginning of time to that month. Figure 2 shows the desired result in the first ten months of 2004.
| Month | PeopleJoined | PeopleLeft | Subscribers |
|---|---|---|---|
| 1/31/2004 | 167 | 0 | 167 |
| 2/29/2004 | 133 | 0 | 300 |
| 3/31/2004 | 144 | 0 | 444 |
| 4/30/2004 | 155 | 0 | 599 |
| 5/31/2004 | 156 | 0 | 755 |
| 6/30/2004 | 136 | 1 | 890 |
| 7/31/2004 | 138 | 0 | 1028 |
| 8/31/2004 | 132 | 0 | 1160 |
| 9/30/2004 | 163 | 0 | 1323 |
| 10/31/2004 | 135 | 0 | 1458 |
Figure 2.
Power BI Desktop is a very versatile tool, there is more than one way of transforming the original table into the result we want. I could perform all the calculations and transformations in the Query Editor window using operations enabled by UI plus a little M programming language. But today I am going to show you how to do this in the Data Tools windows using DAX programming language. DAX runs on top of the blazingly fast column-based, in-memory Vertipaq engine, you are likely going to get the best possible performance playing with your data this way. Besides, in the current release of Power BI Desktop, DAX formula bar comes with powerful IntelliSense which makes authoring a DAX expression so much easier. For full disclosure, I have been a key contributor to DAX development from the beginning therefore I have the ulterior motive of promoting the language I helped created. Unlike Kathi in her blog, I am not trying to develop the fastest possible solution through clever language trickeries, instead, I am going to show you how to arrive at the final solution in a step-by-step fashion so you can see the intermediate results after each step.
If you want to try out the steps on your own from the very beginning and have a SQL Server readily available, please download the script SubscriptionList.sql from Kathi’s blog page to create sample data table in your SQL Server and then import the data into Power BI Desktop, otherwise, I have created a PBIX file, MonthlySubscriberCount1.pbix, that has already imported the data into a table ‘Registrations’ for your convenience. While I provided in this blog all DAX expressions for you to copy and paste, I encourage you to type them yourselves to learn how easy it is to enter DAX expressions with the help of IntelliSense.
First, let’s see the original data in the Data Tools window by clicking the Data button, see Figure 3.

Figure 3.
In the table ‘Registrations’, we see a list of individual accounts and the dates they joined and left the subscription in the two columns [DateJoined] and [DateLeft]. The data in the table should be similar to Figure 1. While each account must have a real date for the [DateJoined] column, its [DateLeft] column can be empty if the account is still active. Since we want to summarize data at month level, let’s add two calculated columns to the table to show the months in which each subscriber joined and left. We will use DAX EOMONTH function to calculate the last day of the month corresponding to the [DateJoined] or [DateLeft] columns.

Figure 4.
Click the New Column button as shown in Figure 4, and then enter the following DAX formula to add a calculated column called [MonthJoined].
MonthJoined = EOMONTH(Registrations[DateJoined], 0)
Now repeat the steps above to add another calculated column [MonthLeft].
MonthLeft = EOMONTH(Registrations[DateLeft], 0)
After we added the two columns, we have in the table both the date and the month (last day of the month to be precise) for which a subscriber joined or left, see Figure 5. We can now find out the total number of subscribers joined or left in each month.

Figure 5.
Click the New Table button as shown in Figure 6, and then enter the DAX formula shown below to add a calculated table called ‘MonthlyJoined’.

Figure 6.
MonthlyJoined =
SUMMARIZECOLUMNS(
	Registrations[MonthJoined],
	"CountJoined", COUNTROWS(Registrations)
)
Now repeat the steps above to add another calculated table ‘MonthlyLeft’.
MonthlyLeft =
SUMMARIZECOLUMNS(
	Registrations[MonthLeft],
	"CountLeft", COUNTROWS(Registrations)
)
We get two new tables in the model as shown in Figures 7 and 8 respectively. The two tables are also listed under Fields on the right side of the window, see Figure 9.

Figure 7.

Figure 8.

Figure 9.
The formulas of the two calculated tables we just created used two DAX functions, SUMMARIZECOLUMNS and COUNTROWS. SUMMARIZECOLUMNS is an extremely versatile and powerful function. It will take a few blog posts just to explore that function alone. But for today’s purpose, all you need to know is that if you simply supply the columns and calculations you care about as arguments to the function, it will return a new table with those columns and calculated values in the output. While the calculations can be arbitrarily complex DAX expressions, for today’s blog post we only need basic aggregations such as summing the values of a column or counting the number of rows in a table. Note that the columns listed as arguments in SUMMARIZECOLUMNS can be any column from any table in the current model, DAX engine will magically stitch them together by following the relationships defined between tables. If you look at the DAX expression for the ‘MonthlyJoined’ table, we supplied as input arguments one column ‘Registrations’[MonthJoined] and one calculation COUNTROWS(‘Registrations’). SUMMARIZECOLUMNS returns a table of columns. If an argument is a column, it automatically keeps the column name in its output, therefore, we only need to supply new column names for output columns based on calculations. In this case, we picked the name “CountJoined” for the calculation.
 The new column names for calculations are enclosed in double quotes, not square brackets.
COUNTROWS function simply returns the number of rows in its table argument. The magic in our example is that COUNTROWS doesn’t simply return a static count of all rows in the ‘Registrations’ table but rather a dynamic count of rows corresponding to the current value of the [MonthJoined] column or the [MonthLeft] column. If you want to dig deeper into how this magic happens, it will take some really technical blogs to explain so it’s for another time. But for most users, just list the columns and aggregations you want to see in the output, thing will work out just right.
Now if you switch to the ‘MonthlyLeft’ table, you should see a row with empty value for the [MonthLeft] column as shown in Figure 10, that’s because many subscribers never left so their [MonthLeft] value is blank.

Figure 10.
Let’s remove that row by modifying the definition of the table as shown below with the changes highlighted. The changes should be self-evident and expose one power of DAX – that DAX functions are composable. We filter the output table of SUMMARIZECOLUMNS row by row and remove the row with a blank value for the [MonthLeft] column.
MonthlyLeft =
FILTER(
	SUMMARIZECOLUMNS(
		Registrations[MonthLeft],
		"CountLeft", COUNTROWS(Registrations)
	),
	NOT(ISBLANK(Registrations[MonthLeft]))
)
Although it’s great to see count of subscribes joined or left per month, the information is spread in two separate tables, we need to somehow combine the two tables into a single one so we can see the two counts side by side for a given month. For those of you with SQL background, you are likely thinking about searching for a DAX join function by now. While it is possible to write a DAX expression to join the two tables together, let me show you a different way that is faster and arguably more intuitive. We are going to leverage a fundamental feature of Power BI Desktop: creating relationships between tables.
Click Manage Relationships as shown in Figure 11, then click the New button as shown in Figure 12. In the Create Relationship dialog box, select table ‘MonthlyJoin’ and column [MonthJoined] as the first end of the relationship, select table ‘MonthlyLeft’ and column [MonthLeft] as the second end of the relationship. Click Advanced options to check whether Cross filter direction is set to Both by default and if not change it to Both as shown in Figure 13. Click the OK button to accept the new relationship and then click the Close button to close the Manage Relationships dialog box.
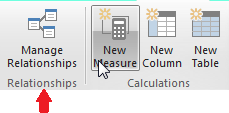
Figure 11.
![]()
Figure 12.

Figure 13.
Now we are ready to create yet another calculated table to bring the columns [CountJoined] and [CountLeft] together. Click New Table, shown in Figure 6, and enter the following DAX expression to create a new calculated table called ‘MonthlyJoinedAndLeft’. The newly created calculated table is shown in Figure 14.
MonthlyJoinedAndLeft =
SUMMARIZECOLUMNS(
	MonthlyJoined[MonthJoined],
	"CountJoined", SUM(MonthlyJoined[CountJoined]),
	"CountLeft", SUM(MonthlyLeft[CountLeft])
)
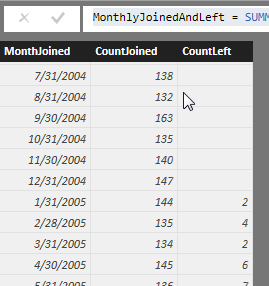
Figure 14.
Since the new table only has a single month column, it no longer makes sense to call it [MonthJoined], so let’s just rename it to [Month]. We do that by expanding the ‘MonthlyJoinedAndLeft’ table on the right and then right click the [MonthJoined] column, select Rename from the dropdown menu as shown in Figure 15.

Figure 15.
We are almost there. Let’s add a column to the newly created table to show the difference between the number of subscribers joined and the number that left. The DAX formula is:
CountNetJoined =
MonthlyJoinedAndLeft[CountJoined] - MonthlyJoinedAndLeft[CountLeft]
The table now looks like Figure 16.

Figure 16.
We are ready to count the number of active subscribers by the end of each month. The math is to add up all net joined subscribers up to the current month. The DAX formula for the calculated column is
Subscribers =
SUMX(
	FILTER(
		MonthlyJoinedAndLeft,
		[Month] <= EARLIER([Month])
	),
	[CountNetJoined]
)
This formula is almost self-explanatory except for that mysterious EARLIER function. Without going into the gory details, it’s enough to say that for each row in the table the formula starts a new scan of the ‘MonthlyJoinedAndLeft’ table, keeps only those rows whose value of the [Month] column is on or before the value of the same column of the current row, and then sums up all the values of the [CountNetJoined] column. The final result is shown in Figure 17 and if you have tried out the T-SQL queries in Kathi’s blog you can verify that our results match the T-SQL ones.
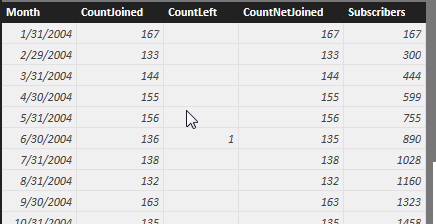
Figure 17.
Last but not least, we can’t call it Power BI without a nice chart to show off our calculations. Since the source data is generated, if we plot total subscribers per month we will see a boring linear growth of subscribers over time. So I created an Area Chart showing monthly count of subscribers joined and left respectively. The chart is shown in Figure 18, and since Power BI is very easy to use, I’ll leave it to you to figure out how to create the chart on your own. You can download the final MonthlySubscriberCount2.pbix file to examine all the calculated tables and their DAX formulas.

Figure 18.

Very educating and well written post about a new concept for me in Power BI. Enjoyed the link to Kathi’s blogpost. Thanks Jeffrey, glad to see you back.
LikeLike
Thanks for a very nice example of the use of calculated tables. One question: will the relationship between the tables work if there is a month with leavers but no new subscribers?
LikeLike
Very good question. The generated data actually contains subscribers leaving in 2010 but no data for subscribers joined in 2010. I don’t want to show such data in the final report because it just looks weird.
In this particular case, you can choose MonthlyLeft[MonthLeft] instead of MonthlyJoined[MonthJoined] in the DAX formula for the calculated table MonthlyJoinedAndLeft.
In the general case, there can be missing months in both MonthlyJoined and MonthlyLeft, we’ll need a column that contains all the months combined from both tables. There are many ways to achieve this. I think an intuitive way is to create a separate ‘Date’ table with a single column that combines dates from both the [MonthLeft] column and the [MonthJoined] column. You can then create one relationship from MonthlyJoined to ‘Date’ and another relationship from MonthlyLeft to ‘Date’. If we are lazy, the formula for the ‘Date’ table can be simply
Date = CalendarAuto()
This formula asks DAX engine to automatically search for all dates in the model and create a full range of dates based on the smallest date and the largest date. This lazy approach works because SummarizeColumns function has another nice property that it automatically excludes dates when there is no one joined or left. Another potential for this approach is that it enables us to create a different type of report that includes those months in the middle when there is no activity.
Of course if all we want is a distinct union of months from both the [MonthJoined] column and the [MonthLeft] column, we can write a more complex DAX formula:
Date = FILTER(DISTINCT(UNION(VALUES(MonthlyJoined[MonthJoined]), VALUES(MonthlyLeft[MonthLeft]))), NOT(ISBLANK([MonthJoined])))
DAX Union function doesn’t remove duplicates, so we wrap it inside Distinct function that removes duplicates. The outmost Filter function removes the blank row so the column is ready to become the primary key end of a relationship.
LikeLike
Excellent, thanks.
LikeLike
Thanks for letting me know about the CalendarAuto() function. I have just used it for a client project in which a bunch of tables each had a date field and we wanted to be able to filter all of them at the same time. I create the Date table, then the relationships, and voilá.
LikeLike
[…] Jeffrey Wang has moved to a new blog for Power BI DAX topics, and his first article shows how to use a calculated table to figure out monthly subscriber churn. […]
LikeLike
Why is the relation created a many to one? One to one seems more correct or it does not matter?
LikeLike
Good question. There are months in one table but not in the other, the algorithm to determine cardinalities on both ends of the relationship falls back to a conservative choice. You can manually change the relationship to one-to-one.
LikeLike
Thanks Jeffrey.Is it correct that the filter part overrules the relation here?
LikeLike
I am not sure I understand your question.
LikeLike
I think that you are right about the cardinality. A single date joined can have several date left. My mistake. Changing it to one to one does not change any results though.
LikeLike
That’s right. With bi-directional cross-filtering on, it doesn’t make any different in our example.
LikeLike
Will the filtering part always overrule a wrongly set cardinality?
LikeLike
Post private discussion here to answer the question:
Cardinality and cross-filtering are two orthogonal features. Cardinality determines join type (left outer join, right outer join, inner join) and whether a blank row is inserted into the table on the one-side of a relationship. Bi-directional/uni-directional cross-filtering determines whether a join should happen at all.
LikeLike
Thanks Jeffrey…. extremely well written and enlightening.
LikeLike