One of the key powers of Power BI is the ability to bring data from different sources into a single model and then join them together by creating relationships among tables to perform analysis and create reports across all the data in the unified model. But a lot of people are confused when they run into one of the errors below while trying to create a relationship between two tables inside Power BI Desktop:
- We cannot create a relationship between ‘Table A'[Column X] and ‘Table B'[Column Y]. This could be because there is missing intermediate data to connect the two columns.
- You can’t create a relationship between these two columns because one of the columns must have unique values.
- You can’t create a relationship between these two columns because the ‘Column X’ column in the ‘Table A’ table contains null values.
Those who are familiar with relational database theories can appreciate the sound principles underlying those error messages. But many users of Power BI may be at a loss of what to do next. While Power BI Desktop can make creating relationships easier in the future by helping users resolve those errors automatically, there are things you can do today to connect the two tables together. The same methodology can be generalized to connect any number of tables together through a common column.
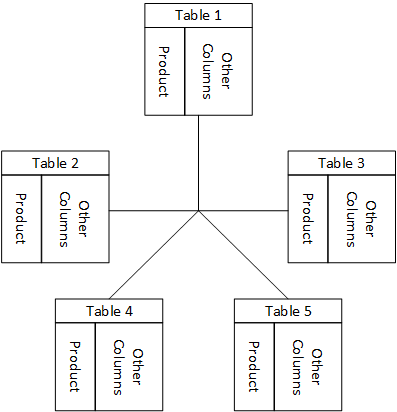
Assume a user has imported five different tables containing various information and transactions about products, all of which identify each product by a [Product] column, but the user is unable to create relationships among the tables as he or she is blocked by the errors listed above. The user wants to connect all five tables together via the [Product] column as illustrated by the conceptual schema in Figure 1.
To do so we need to use DAX to create a calculated table in the middle so that the five original tables can each create a relationship between itself and the calculated table. I have created a mock model in this pbix file to demonstrate the technique.
Create a calculated table by clicking the New Table button as shown in Figure 2.

The DAX expression is
All Products =
FILTER(
DISTINCT(
UNION(
DISTINCT(Table1[Product]),
DISTINCT(Table2[Product]),
DISTINCT(Table3[Product]),
DISTINCT(Table4[Product]),
DISTINCT(Table5[Product])
)
),
NOT(ISBLANK([Product]))
)
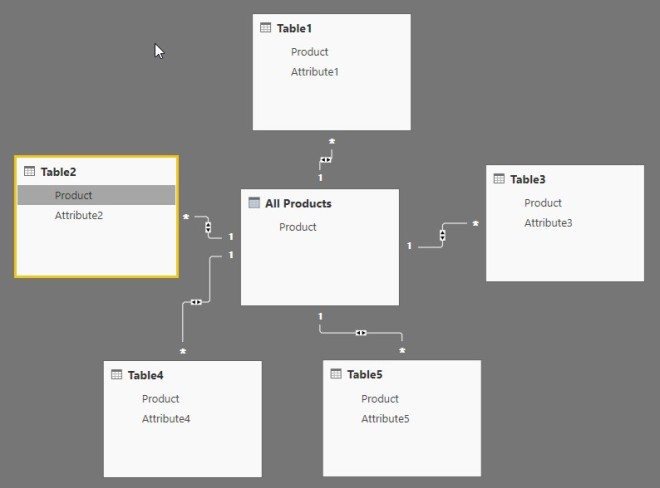
This DAX formula takes the unique values from the [Product] column of each of the five tables, unions them together, removes duplicate values, and finally removes the BLANK value if there is one. You can use the same formula in any model by changing the number of tables and the names of tables and columns. Now you can create five relationships between each of the five original tables and the newly created calculated table. Figure 3 shows the final result in the Relationships view. You can see that every relationship allows filters to flow both ways as indicated by  .
.
Now that all fields in the model are connected, you can freely add any column from any table to your report, slice and dice to your heart’s content, things will just work as if by magic. Moreover, the calculated table in the middle will automatically recalculate each time you refresh data in the original tables.

Reblogged this on George's BI Blog.
LikeLike
Excellent tips, thank you
LikeLike
Excellent….thanks for sharing this!!
LikeLike
Thank very much
LikeLike
Brilliant. Thanks for your valuable insights explained in such a clear manner.
LikeLike
This is extremely helpful, thank you for sharing! What about if the columns hold similar data but have different column headers? I have 4 tables with columns holding MM/YYY but have four different headers, how do I change formula for it to work?
LikeLike
The UNION function does its job based on the position of the columns, not the names of the columns. In this case, each argument of the UNION function only returns a single column, therefore it will just work as long as you make sure the data types of those columns match. The result of the UNION function inherits the column name of the first argument, but you can always change the column name afterwards in the UI.
LikeLike
Jeffrey, what if you need to create a complex relationship between each table is it just a matter of using DISTINCT(Table1[Product]&&Table1[Region])?
Thanks again, this is a great site.
LikeLike
If by complex relationship you mean joining two tables by two or more columns from each table, Power BI Desktop only supports creating a relationship by joining a single column from each table, so you must first create a calculated column to combine the multiple columns into a single column, e.g. using string concatenation operator &. Afterwards you can use the technique described here on top of the calculated columns.
LikeLike
Great article. Is there a way to do something similar in PowerPivot for Excel rather than the Power BI? Thanks.
LikeLike
This technique doesn’t work for PowerPivot because it doesn’t support bi-directional cross-filtering.
LikeLike
If I add Product from All Products, Attribute1 from Table1 and Attribute2 from Table2, I have an error that there’s no relationship between Table1 and Table2. Is that normal?
LikeLike
No, it’s not normal. Make sure the relationships do exist, as shown in the diagram, and are active. If you still run into the same issue after checking and are willing to share with me your workbook, I can help take a look.
LikeLike
Hi Paulo,
My previous reply was incorrect as I misunderstand your question. Frank has asked the same question again. Please see my reply that explains the error.
LikeLike
I have dowloaded your PBIX file for testing purpose, and tried adding different attributes to a Table. It gives error Cant display the visual.
LikeLike
If you get this error message “Can’t display the data because Power BI can’t determine the relationship between two or more fields.”, that’s a UI limitation that forces you to add a measure to the visual.
LikeLike
Using the file you provided I have the same problem as Paulo.
Of course all the relationships do exist, as shown in the diagram, and are active.
I add Product from All Products and Attribute1 from Table1. Then adding an additional Attribute is just not possible.
LikeLike
Version: 2.52.4921.682 64-bit (November 2017)
LikeLike
Sorry guys, I misunderstood Paulo’s question. The behavior is by design. In a sense, this is a product limitation. Basically, when several columns are added to a visual but no measure is added, the product has some logic to avoid unintentional large crossjoin between columns from multiple tables by injecting a hidden measure. The hidden measure logic is based on a star schema without taking bi-directional cross-filtering into consideration. Since ‘All Products’, ‘Table1’, ‘Table2’ don’t form a star schema, the logic raises an error. You can add any measure to the same visual to work around the issue.
LikeLike
Super useful! thanks!
LikeLike